
This post was originally published by the Digital Learning Collaborative on April 21, 2022.
The recently released Michigan’s K-12 Virtual Learning Effectiveness Report for the 2020-21 school year provides a comprehensive, statewide view of all virtual learning in Michigan. The report findings highlight the tremendous impact of emergency closures and the sheer volume of districts turning to virtual learning during the pandemic. The report is based on pupil completion and performance data reported by public schools to the Michigan Department of Education and the Center for Educational Performance and Information.
During the 2020-21 school year, about 4 out of 5 Michigan public K-12 school districts had one or more virtual learners. On average, close to 3 out of 10 students took at least one virtually-delivered course. Imagine for a moment that we organized all virtual learners in the state from 2020-21 into multi-age groups of 25 students, roughly an average class size.
In the average “classroom” of virtual learners we would find that:
- 2 students were new to the district
- Half were female
- 11 were in grades 9-12; 5 were in grades 6-8; and 9 were in grades K-5
- 14 identified as White; 7 identified as African American or Black; 2 identified as Hispanic or Latino; and the rest identified as one or more races
- 3 used special education services
- 16 were in poverty
- 14 took all of their coursework for the year virtually
- 14 passed every virtual course they took; 7 passed some and failed some; and 4 didn’t pass any
Oh, and we would need 16,740 of these classroom groupings to account for the more than 418,500 students who used virtual learning in 2020-21. To put the scale of 418,500 learners into perspective, consider another fun fact about Michigan: The Mackinac Bridge, which connects Michigan’s Upper and Lower Peninsulas, is the longest suspension bridge in the western hemisphere. The full length of the bridge is just shy of five miles long. Each Labor Day, the bridge closes for a public walk. If each of the virtual learners showed up for the walk, they alone would fill the bridge—six times!*
Figure 1. The Mackinac Bridge
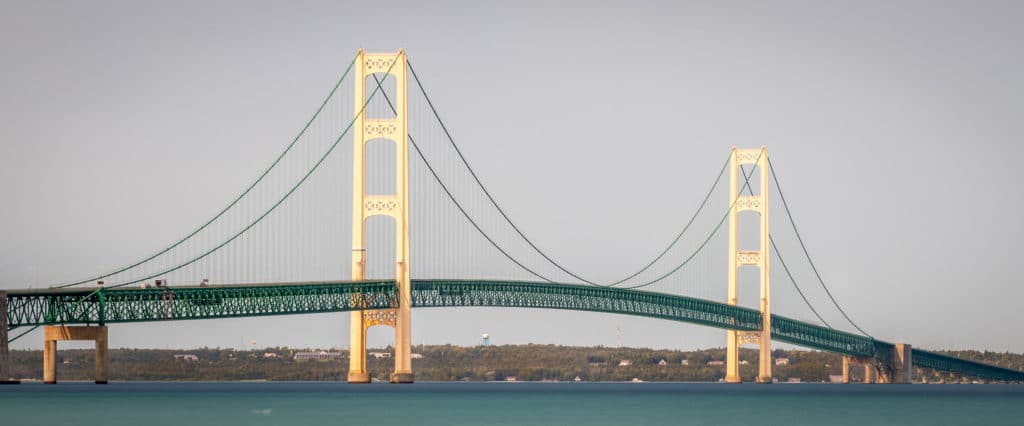
Photo Credit: “Mackinac Bridge” by Mike is licensed under CC BY-NC-ND 2.0
The 2020-21 report is the ninth publication in the series. Over 80 data tables are included capturing data on virtual learners, enrollments, and pass rates. Figure 2 shows a few trends from the report series.
Figure 2. Summary of Virtual Learning Metrics by School Year Since 2010-11
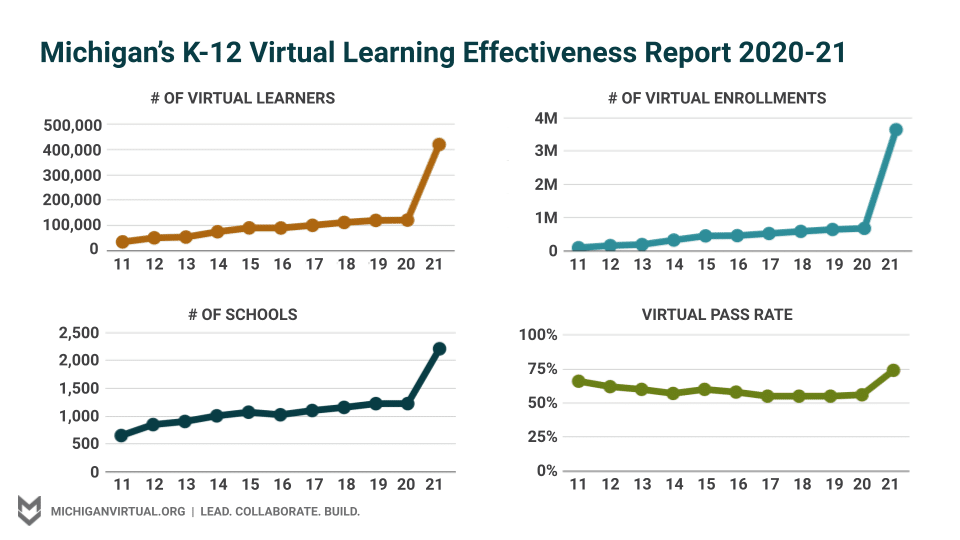
The large upticks in learners, enrollments, and schools may have been anticipated given the COVID-19 precautions. For instance, we saw a one-year increase of almost three million virtual enrollments. Only about 1 out of 10 virtual enrollments came from full-time virtual or cyber schools, which demonstrates the massive—and likely temporary—effect of the pandemic. During 2020-21, many districts ceased all in-person learning options and shifted learning to emergency models that frequently included some form of virtual learning.
What may be the most surprising gain is the 18% increase in the virtual pass rate. Such an increase could appear out of line with media reports and other pandemic-focused virtual learning research, which have noted learning loss related to remote learning. How might we explain that jump and, perhaps more importantly, can we expect it to continue? Here is how our team at Michigan Virtual thinks about the increase in the virtual pass rate, and why we conclude it is not likely to last. Consider the following four observations:
First, over half of the virtual enrollments for the 2020-21 school year came from schools that didn’t report any enrollments in the prior school year. These new schools had an 80% virtual pass rate, which lifted the state’s overall rate. It is unclear if, but also unlikely that, all or most will continue their levels of virtual learning in the coming years.
Second, there was a dramatic swing in the proportion of virtual enrollments from alternative education schools. In 2019-20, about half of the enrollments came from alternative education schools. In 2020-21, they represented only 1 out of 10 virtual enrollments. This change was not due to a drop in alternative enrollments; in fact, they grew by 13%. That growth, however, was dwarfed by the over 800% increase for general education schools. Given that the virtual pass rate for general education students trends about 20 percentage points higher than alternative education students, it seems likely the overall pass rate will drop since we predict the number of general education enrollments will fall quicker than the number of alternative education enrollments.
Third, there was also a huge shift in the grade levels of virtual learners. While past editions of the report found that virtual learning was predominantly used at the high school level, the 2020-21 report found it more evenly distributed with close to 40% of the virtual enrollments coming from students in grades K-5. This drastic rise in the proportion of elementary enrollments seems to reflect districts suspending in-person learning options for part or all of the school year; therefore, it will likely be temporary. Since past performance data suggest that students in lower grades tend to perform better than students in higher grades, we predict that as the proportion of virtual enrollments in the lower grades drops, so too, will the virtual pass rate.
Finally, we hypothesize that schools were simply more lenient. The disruption to most schools, teachers, students, and families was extremely stressful. Many schools talked about “giving grace,” which in some cases included things like lightening student workload expectations or even being more lenient with grading policies and practices. We anticipate that these exceptions will revert back to past expectations in the coming months.
The prediction of backsliding on the virtual pass rate does not paint the rosiest of pictures. That said, it is important to point out that meaningful differences sometimes appear when focusing on subgroups. For instance, a little more than one out of every three schools with virtual learning reported virtual pass rates of 80% or higher. In these schools, the 2020-2021 data show:
- Higher performing schools supported various numbers of students, enrollments, and course offerings.
- Both Local Education Agency (LEA) schools and Public School Academy (PSA) schools had higher performing schools, though PSAs had a higher percentage reaching this threshold.
- Higher performing schools existed in rural, town, suburban, and city settings. Suburban and city schools were more likely to reach the 80% standard.
- Higher performing schools saw more equitable outcomes among students of different races or ethnicities. African American or Black, Hispanic or Latino, and White students all achieved virtual pass rates of 90%.
- Students in poverty from higher performing schools had a virtual pass rate of 89%. This was 20 percentage points higher than the average for all virtual learners in poverty.
These data points continue to add to the evidence that virtual learning can and does work.
Michigan’s K-12 Virtual Learning Effectiveness Report, 2020-21 is worth the read regardless of whether you work or live in Michigan or see yourself as an opponent or proponent of virtual learning. The report can provide informative benchmarks or even spur ideas for evaluating your local programs. And though I haven’t checked, I am pretty sure it can be read in less time than it would take to walk the Mackinac Bridge!
* For those interested in the math behind the bridge example, here is the logic: The Annual Mackinac Bridge Walk uses the two outside lanes of the bridge. Each lane is 12 feet wide by 26,372 feet long. In total, the two lanes reflect 632,928 square feet of road. Allocating each walker a scant 3 by 3 foot section of the road, about 70,325 people could fit on the two lanes at one time. 418,500 learners divided by 70,325 is 5.95, which I rounded up for simplicity.